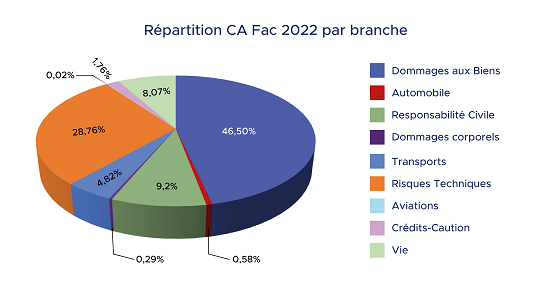
Turnover Fac per area branch
|
Branch |
2021 |
2022 |
%2022 |
|
|
Properties Damages |
4 543 882 973 |
4 784 486 467 |
46,50 |
|
|
Motor |
77 949 763 |
59 870 355 |
0,58 |
|
|
Liabilities |
793 189 935 |
945 842 929 |
9,2 |
|
|
Personnal accidents |
34 404 235 |
29 857 552 |
0,29 |
|
|
Transports |
325 593 784 |
496 244 995 |
4,82 |
|
|
Engeniering |
2 679 539 237 |
2 959 547 724 |
28,76 |
|
|
Aviation |
5 257 460 |
2 244 185 |
0,02 |
|
|
Credit |
226 431 053 |
180 546 275 |
1,76 |
|
|
Life |
959 762 486 |
829 721 241 |
8,07 |
|
|
Total |
|
|
100,00 |
|
Breakdown per Turnover Fac 2022, per branch
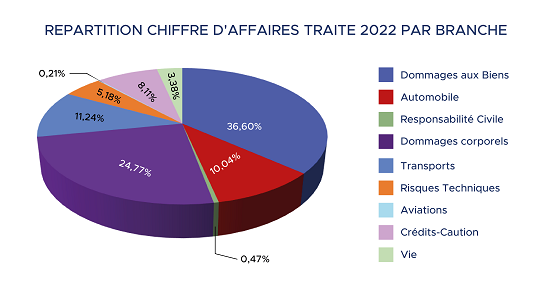
Treaty Gross Premium per class of business
|
Branch |
2021 |
2022 |
%2022 |
|
|
Properties Damages |
1 355 578 572 |
3 070 044 708 |
36,60 |
|
|
Motor |
428 475 846 |
842 590 544 |
10,04 |
|
|
Liabilities |
3 577 259 |
39 479 686 |
0,47 |
|
|
Personnal accidents |
319 860 696 |
2 077 833 562 |
24,77 |
|
|
Transports |
354 235 367 |
942 934 932 |
11,24 |
|
|
Engeniering |
357 287 695 |
434 305 151 |
5,18 |
|
|
Aviation |
3 412 366 |
17 643 035 |
0,21 |
|
|
Credit |
243 106 840 |
680 286 023 |
8,11 |
|
|
Life |
295 722 257 |
283 383 923 |
3,38 |
|
|
Total |
|
|
100,00
|
|
TREATY GROSS TURNOVER FOR 2022 PER CLASS OF BUSINESS